GRE General Test · Quantitative Aptitude
Data Interpretation
Analysis of data presented in tables, bar graphs, line graphs, pie charts, histograms and caselets.
Six concepts. Data interpretation is not a new chapter of arithmetic — it is percentage, ratio and average asked off a table or a chart, with the trap moved into the scale, the base year or the wording. Read the axes once, compute the shared totals once, and every sub-question after that is division.
- GRE General Test
- Medium level
- 6 concepts
- 45 practice questions
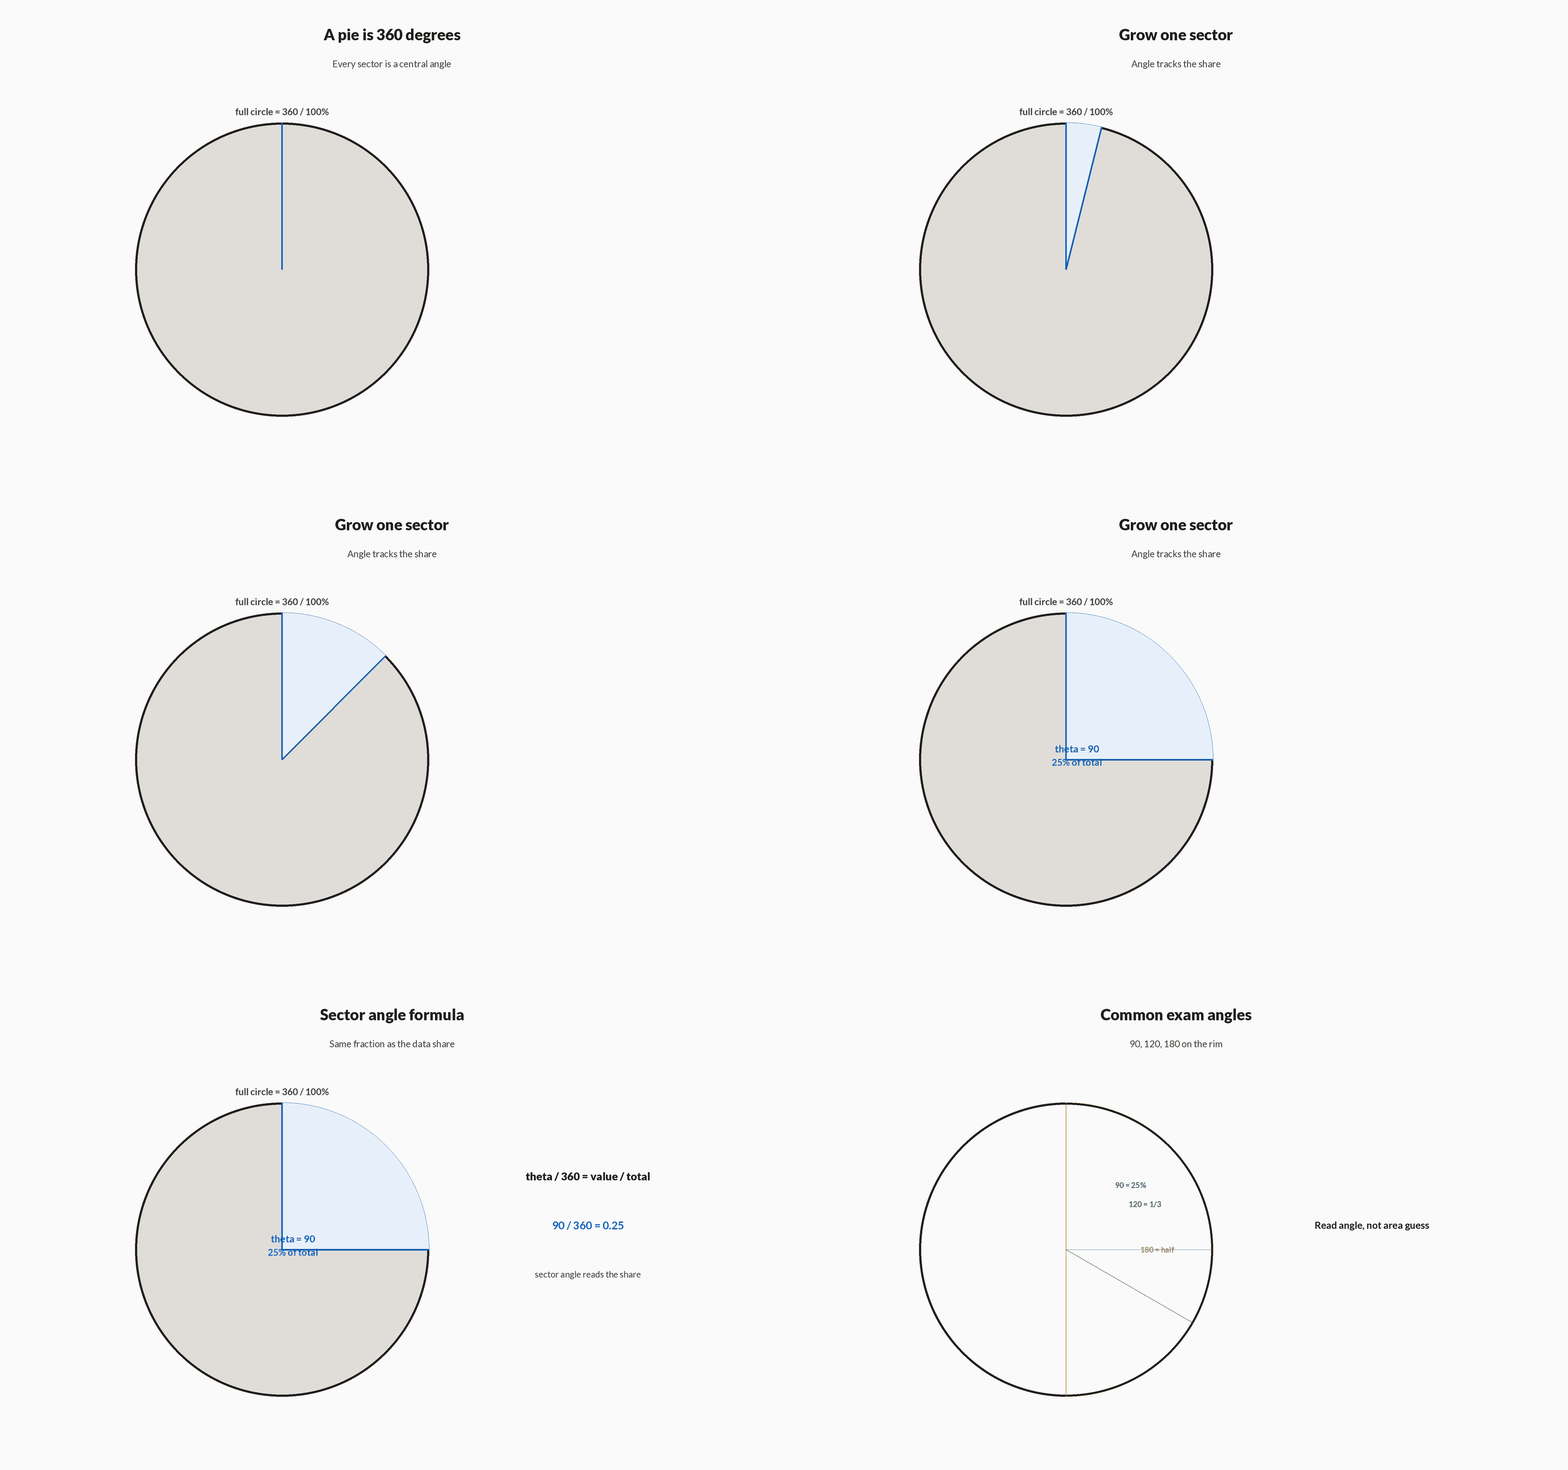
1A pie sector is a fraction of 360°
The full circle is the whole — 100\% or 360^\circ — and a sector's central angle is its share written in degrees: \theta = \frac{\text{value}}{\text{total}}\times 360^\circ. Working the other way, a value is \frac{\theta}{360^\circ}\times\text{total}. Nothing else about a pie chart is content; every pie question is this fraction.
The conversion worth knowing cold is 1\% = 3.6^\circ, so a 90^\circ sector is instantly 25\%, a 120^\circ sector is one-third, and a 180^\circ sector is half. Learn those three angles and most pie arithmetic collapses before the calculator comes out.
How it works
- Name the wholeThe pie's total — rupees, units, or 100% — is the denominator for every sector.
- Turn the angle into a fractionDivide the sector angle by 360^\circ, or convert with 1\% = 3.6^\circ when the question asks for a percent.
- Multiply by the totalFraction times total is the component value; value over total times 100 is the percentage share.
| Central angle | Fraction of pie | Percentage share |
|---|---|---|
| 36° | 1/10 | 10% |
| 45° | 1/8 | 12½% |
| 60° | 1/6 | 16⅔% |
| 72° | 1/5 | 20% |
| 90° | 1/4 | 25% |
| 120° | 1/3 | 33⅓% |
| 180° | 1/2 | 50% |
Value from a pie-chart sector
In a pie chart of a family's monthly budget of ₹36000, the Food sector has a central angle of 120^\circ. Find the amount spent on food.
- Fraction for food = 120°/360°1/3
- (1/3) × 3600012000
- Check via 1% = 3.6°: 120°/3.6°33⅓%
- 33⅓% of ₹36000₹12000
Pro tip. A 120^\circ sector is always exactly one-third of the total — learn the common angles (90^\circ\to\frac14, 180^\circ\to\frac12) so the fraction is read, not computed.
A pie chart totals ₹48000. A sector of 90° represents
- ₹12000
- ₹16000
- ₹24000
90° is a quarter of 360°, so the sector is (1/4)×48000 = ₹12000. Taking 90/360 of 48000 as 90/270 (dropping a zero from both) gives ₹16000; treating 90° as half gives ₹24000. The angle is always over 360°, never over 270° or 180°.
2Read the scale before you read the bars
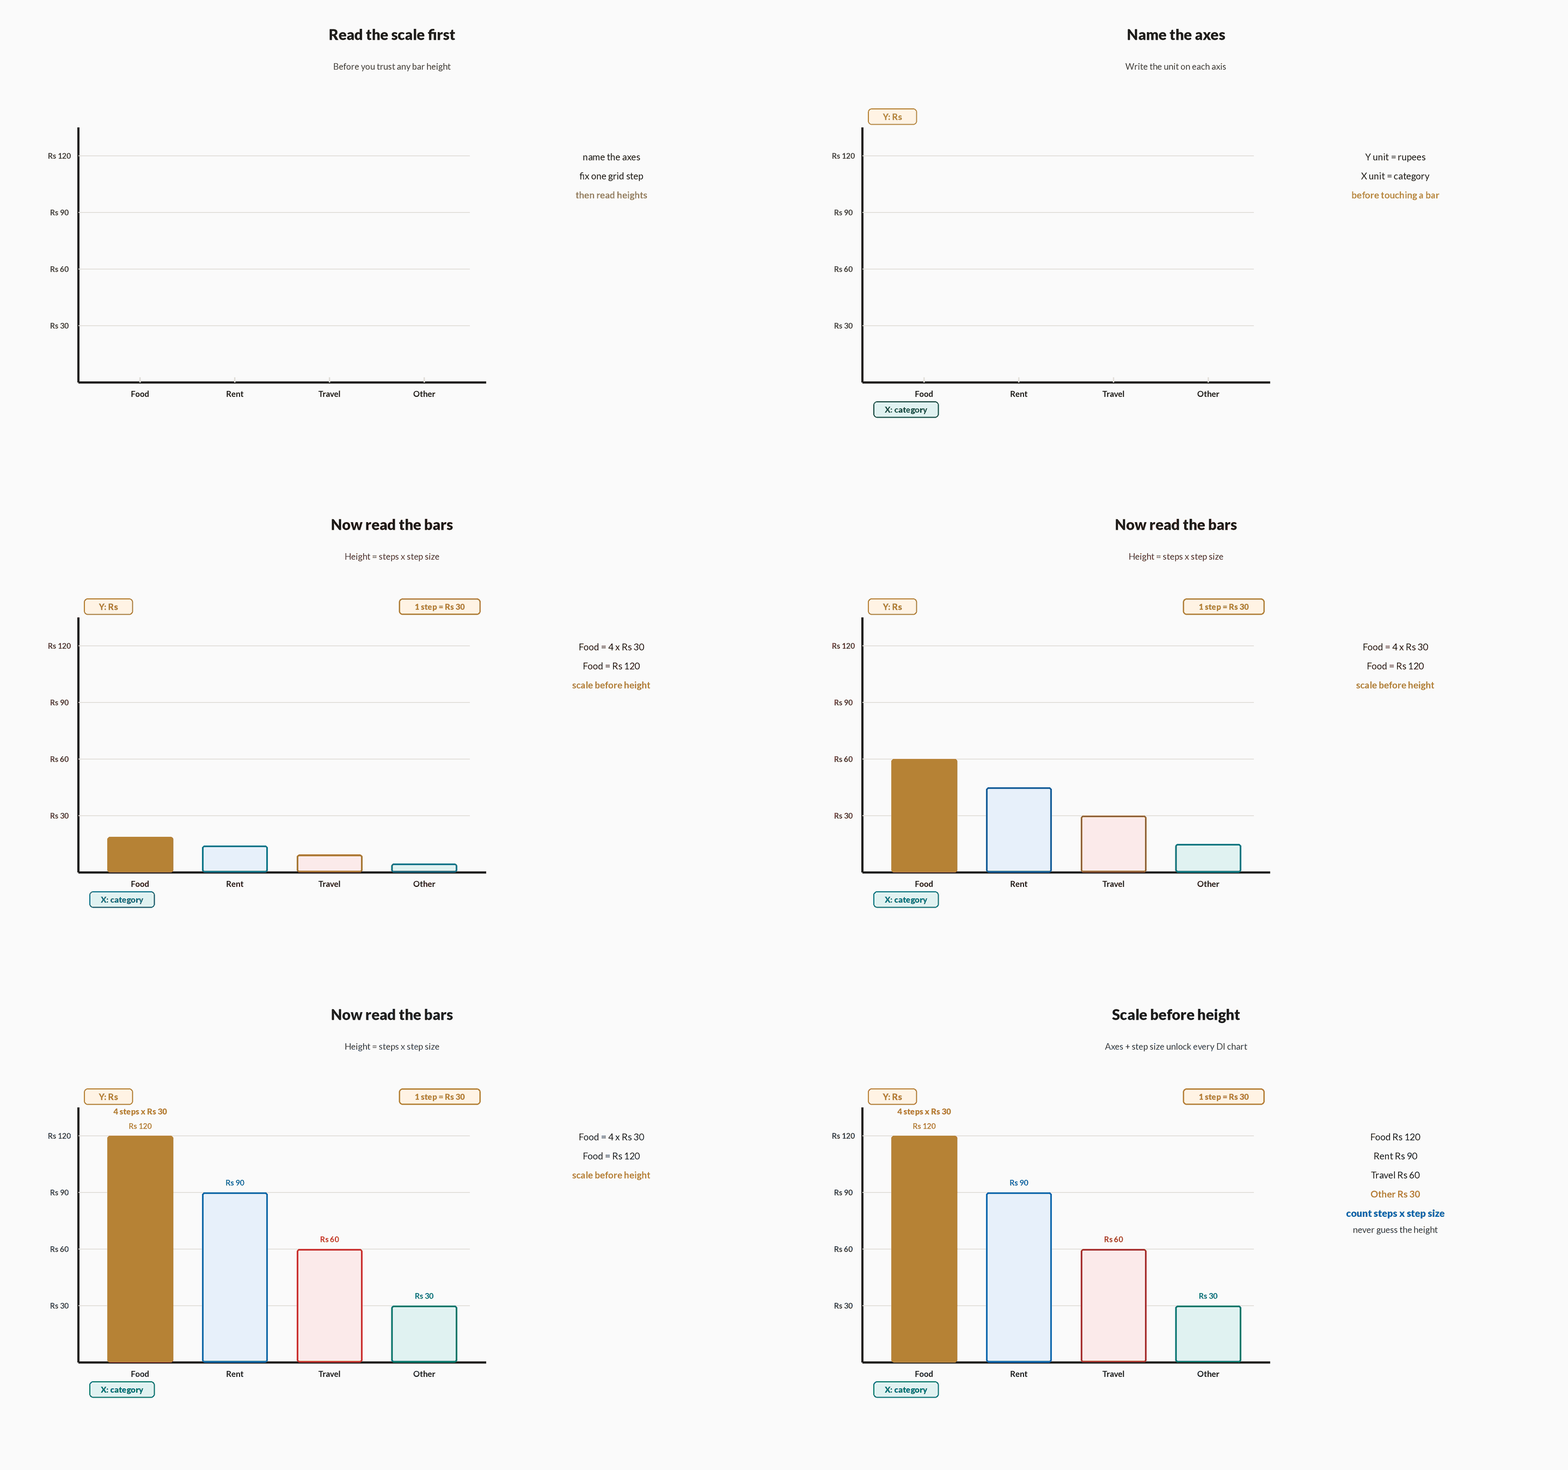
Every bar and line graph question begins with the same two checks: what the axes measure, and what one unit of length is worth. Misreading a scale mark of 10 as 1, or treating a broken axis as starting at zero, produces an answer that looks exact and is wrong by a factor.
Bar graphs compare discrete categories — years, products, regions — so the height (or length) of each bar is a value you can read off and then ratio or average. Line graphs emphasise trend and growth over a continuous axis, usually time; the slope between two points is the change, and a steeper segment is a faster rise, not a larger absolute value unless the scale says so.
How to read a chart
- Name the axesWrite down the unit on each axis — ₹ crore, thousands of units, percent — before touching a bar.
- Fix the scaleOne grid step is a fixed amount; count steps, then multiply. A broken axis does not change the step size above the break.
- Choose bar or slopeA category comparison reads bar heights; a growth question on a line graph reads the change between two years, not a single point.
Category share from a bar chart
A bar chart of monthly spending shows Food ₹120, Rent ₹90, Travel ₹60 and Other ₹30. What percent of the total is spent on Food, and what is the ratio of Rent to Travel?
- Total = 120 + 90 + 60 + 30₹300
- Food share = 120/300 × 10040%
- Rent : Travel = 90 : 603 : 2
- Check: Food is 120 of 3002/5 = 40%
Pro tip. When several questions share one chart, compute the grand total once and park it — every percent and every ratio after that is a single division off that total.
Bars for A, B and C read 40, 60 and 20. B as a percent of the total is
- 50%
- 60%
- 40%
Total = 40 + 60 + 20 = 120, so B is 60/120 × 100 = 50%. Answering 60% reports the bar's own reading as a percent; answering 40% is A's share. A bar value is never already a percent of the total unless the axis says so.
3Percentage change, always on the earlier value
Growth between two periods on a chart is \frac{\text{later}-\text{earlier}}{\text{earlier}}\times 100. The numerator is the rise or fall you can see; the denominator is the year you are changing from — never the later year, and never whichever bar looks larger.
That single choice is the DI trap with the highest yield. Dividing by the later value understates a rise and overstates a fall, and the wrong answer is almost always sitting among the options as the distractor.
Figure. Two vertical bars labelled 2023 and 2024 with values 250 and 300, so the later bar is taller by the growth of 50 that percentage change measures against the earlier bar.
How it works
- Read both valuesTake the earlier-period reading and the later-period reading off the chart, with units.
- SubtractLater minus earlier; a negative result is a decrease, not a sign error.
- Divide by the earlier valueThen multiply by 100. The base is the period named as the starting point.
Percentage growth between two years
A company's sales were 250 units in 2023 and 300 units in 2024. Find the percentage growth.
- Growth = (300 − 250)/250 × 10050/250 × 100
- 50/2501/5
- (1/5) × 10020%
- Trap: 50/300 × 10016⅔% (wrong base)
Pro tip. Always divide the increase by the earlier (base) year, never the later year. If 16⅔% is an option beside 20%, the trap has been baited on purpose.
A quantity falls from 300 to 240. The percentage decrease is
- 20%
- 25%
- 16⅔%
Decrease = 60 on a base of 300, so 60/300 × 100 = 20%. Dividing by the later value 240 gives 25%; dividing the later by the earlier and subtracting from 100 gives a muddle near 16⅔%. The base of a fall is the higher, earlier reading.
4"A more than B" anchors the denominator on B
When a DI set asks "by what percent is A more than B", the wording has already named the base: B. The percent is \frac{A-B}{B}\times 100. Swapping the denominator to A answers a different question — how much percent B is less than A — and the two numbers are not equal.
The same sentence with "less than" still anchors on the word after than. Underline that word before you divide; it is the whole mark.
Figure. Two vertical bars B = 400 and A = 480 with a dashed reference rule at 400 marking B as the base for the percent-more reading of the gap of 80.
How it works
- Underline the baseThe noun after "more than" or "less than" is the denominator.
- Take A − BThe gap is the same either way; only the base changes which percent you report.
- Divide by the underlined valueThen × 100. Check the options for the swapped-base distractor.
More than, not less than
From a chart, product A sold 480 units and product B sold 400 units. By what percent is A's sale more than B's?
- Gap = 480 − 40080
- Base is B (after "more than")400
- 80/400 × 10020%
- Trap: 80/480 × 10016⅔% (B less than A)
Pro tip. 20% more and 16⅔% less are the same gap on two bases. If both appear in the options, the question is testing which noun followed "than", not your subtraction.
X = 360 and Y = 300. X is more than Y by
- 20%
- 16⅔%
- 60%
Gap 60 on base Y = 300 gives 20%. Dividing by X = 360 gives 16⅔%, which is how much percent Y is less than X. Reporting the raw gap 60 as a percent is the third distractor.
5Compute shared totals once, then answer by division
A DI set is several questions on one table. The expensive work is adding each category across years and adding each year across categories — do that once, write the totals in the margin, and every ratio, average and percentage share after that is a single division off those parked numbers.
An average across n periods is \frac{\text{sum of values}}{n}. A ratio of two categories is their two totals. Recomputing a column sum inside every sub-question is how time runs out with the arithmetic still correct.
Figure. Add each row once — P totals 150, Q totals 225 — and write those margin totals before touching any question. Every later share, ratio or average is one division off a parked total.
How it works
- Total each seriesSum every category across the years (or every year across the categories) and write the results beside the table.
- Park the grand totalAdd the category totals; this is the denominator for every share-of-whole question.
- Answer by divisionRatios divide two parked totals; averages divide a parked total by the count of periods.
| Year | P | Q |
|---|---|---|
| 1 | 40 | 60 |
| 2 | 50 | 75 |
| 3 | 60 | 90 |
| Total | 150 | 225 |
One table, three answers from two sums
Production of P over three years is 40, 50, 60 units and of Q is 60, 75, 90 units. Find (i) the three-year average of P, (ii) the ratio of total P to total Q, (iii) P's share of combined production.
- Total P = 40 + 50 + 60; Total Q = 60 + 75 + 90150 and 225
- Average of P = 150/350
- P : Q = 150 : 2252 : 3
- P's share = 150/(150 + 225) × 10040%
Pro tip. The two totals answered three questions. On a five-question set the same two numbers usually answer all five — compute them before opening question one.
A three-year series reads 20, 30, 40. Its average is
- 30
- 45
- 90
Sum = 90 and n = 3, so the average is 90/3 = 30. Reporting the sum 90, or summing and dividing by 2, are the usual slips when the total was never parked as a separate number from the average.
6Approximate only when the options are far apart
DI options are often well separated — 20%, 25%, 33% — so treating 498 as 500 or 997 as 1000 is legitimate time-saving, not sloppiness. The arithmetic becomes mental, and the nearest option is still unambiguous.
The discipline is checking the gap between options before you round. If two options sit 1% apart, an approximation that moves the answer by 0.5% can pick the wrong one; compute exactly. Rounding is a tool for separated options, not a default.
Figure. Options at 20%, 25% and 33% are far apart, so rounding 498/1550 toward 500/1550 still lands unambiguously on 33%. When two options sit within a rounding error of each other, do the exact division instead.
When to round
- Scan the optionsIf neighbouring choices differ by more than your expected rounding error, approximation is safe.
- Round both sides the same way498/997 ≈ 500/1000; rounding only the numerator (or only the denominator) biases the fraction.
- Fall back to exactClose options, or an answer that lands halfway between two choices, means compute without rounding.
498/997 may be treated as 1/2 when the options are
- 40%, 50%, 60%
- 49%, 50%, 51%
- Never — approximation is always unsafe
498/997 differs from 1/2 by under a tenth of a point, so among options ten points apart the nearest choice is unambiguous. Among options one point apart the same rounding can land on the wrong neighbour. "Never" rejects a tool the paper expects you to use when the options are far apart.
Notes
- Pie Chart Basics: The full circle represents the total (100\% or 360^\circ); a sector's central angle relates to its share by \text{angle}=\frac{\text{value}}{\text{total}}\times360^\circ.
- Reading Bar & Line Graphs: Always note the axis units and scale first; line graphs emphasise trend/growth over time while bar graphs compare discrete categories.
- Percentage Change in DI: For growth between two periods use \frac{\text{later}-\text{earlier}}{\text{earlier}}\times100; a common trap is dividing by the later value instead of the base.
- Ratio & Average Questions: DI sets often ask for the ratio of two categories or an average across years — compute totals once and reuse them for multiple sub-questions.
- Approximation Discipline: Since options are usually well separated, round intelligently (e.g. treat 498 as 500) to save time, but verify closeness of options before rounding.
Formulas
- Sector angle in pie chart: \theta = \frac{\text{component value}}{\text{total}}\times360^\circ
- Percentage share: \frac{\text{part}}{\text{total}}\times100
- Percentage change: \frac{\text{new}-\text{old}}{\text{old}}\times100
- Average of n periods: \frac{\text{sum of values}}{n}
- Value from angle: value =\frac{\theta}{360^\circ}\times\text{total}
Exam traps & shortcuts
- Convert pie-chart degrees to percentages using 1\% = 3.6^\circ so a 90^\circ sector is instantly 25\%.
- For 'by what percent is A more than B', anchor the denominator on B (the base) to avoid the reversed-fraction trap.
- When several questions share one dataset, compute the grand total and each category total once, then answer all sub-parts by division.
Reference tables
Every line is a reading of a chart or table, not a new identity.
| Quantity | Relation | Watch for |
|---|---|---|
| Sector angle | θ = (value/total) × 360° | 1% = 3.6° |
| Value from angle | value = (θ/360°) × total | Common angles: 90°, 120°, 180° |
| Percentage share | (part/total) × 100 | Total from the chart, not from memory |
| Percentage change | (new − old)/old × 100 | Denominator is the earlier value |
| A more than B | (A − B)/B × 100 | Base is the word after than |
| Average of n periods | (sum of values)/n | Park the sum once for the whole set |
Recap
Read only this the night before.
- Pie
- Sector/360° is the fraction. 1% = 3.6°, so 90° = 25%, 120° = 1/3, 180° = 1/2.
- Scale
- Name the axis units and the grid step before reading any bar or point.
- Change
- Growth divides by the earlier period. The later-year distractor is almost always an option.
- More than
- "A more than B" divides by B. The swapped base answers "B less than A".
- Totals
- Sum each series once. Ratios, averages and shares are then one division each.
- Approx
- Round when options are far apart; compute exactly when they sit close.
Practise Data Interpretation
Reading is free and needs no account. Practice, mocks and progress live in the app.
- 45 exam-style questions on this topic, with explanations
- A 5-question practice set that ends the chapter
- Timed mocks scored with the real marking scheme
- Readiness tracked per topic, kept on your device